- 0
By Nick Harris
SJA Internet Sports Writer of the Year
22 April 2011
The best paid sportsmen in the world, judged on average earnings per player across whole leagues, are the basketball players who make their living in the NBA in North America, according to the findings of sportingintelligence’s Global Sports Salaries Report 2011 (GSSS 2011), published today.
Across the 30 teams in the NBA, the average base salary in the latest completed season was £2.9m per player per season, or £55,816 per week. At current exchange rates, that equates to US$4.79m per year (which is €3.29m per year) or US$92,199 per week (which is €63,352 per week).
Earlier this week, we revealed that the best paid teams in global sport were Barcelona (from Spanish football), Real Madrid (ditto) and then the New York Yankees (US baseball), the latter having been knocked off the No1 perch they inhabited in our last report a year ago.
But when measuring leagues as a whole, the NBA is the richest, man for man. One reason for this is that teams (and squads / rosters) have fewer players per team than any other among the world’s major sports leagues. The simplistic conclusion from that is that the pot of wages at each NBA team is divided among fewer players than at, say, each NFL franchise. But that is far from the whole story.
If fewer players meant bigger money, always, then we would expect NHL ice hockey players (with fewer players per team than the NFL) to earn more than NFL players, on average. In our report last year, they did, just.
But this time, NFL players earned more. Why? Because there wasn’t any NFL salary cap or floor in 2010? (That is a much more convoluted debate for another day). But NFL players earned more per man in 2010 than NHL players. In the 2010 season (ending in the 2011 Super Bowl), NFL players earned £1.44m on average each per year (£27,637 per week) according to the GSSS 2011, against ‘only’ £1.39m per NHL player per year on average (£26,822 per week) in the 2010-11 season.
One of the issues – but only one – that we hope to explore on this site in the near future is the argument that NFL players might be the chronically underpaid performers of global sport. That’s for another day.
Back to today, the report contains average team salary calculation for 272 teams from 14 leagues. Those 14 leagues are the NBA (basketball), IPL (cricket), MLB (baseball), Premier League (English football), NFL (US gridiron), NHL (ice hockey), Bundesliga (German football), Serie A (Italian football), La Liga (Spanish football), NPB (Japanese baseball), SPL (Scottish football), AFL (Aussie Rules football), MLS (American soccer) and CFL (Canadian gridiron).
When only weekly pay is taken into account, the No2 league by average pay is cricket’s IPL. It last just six weeks per year but with multi-million dollar short-term contracts for the best players and six-figure deals for many more, it is justifiable for inclusion, not least because many of those involved earn other incomes elsewhere during the rest of the year.
The full contents of the GSSS 2011 are detailed here.
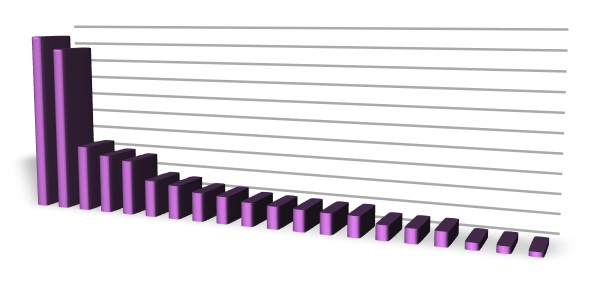
One of the features of the report is a wage distribution chart per league that shows the relative pay levels between the teams in each league. Some leagues have massive discrepancies between the best paid and worst paid teams.
Here is the distribution chart for the league with the biggest discrepancy, where players at the best paid team earn an average of 39.47 times as much as the players at the worst paid team in that league:
And here is the distribution chart for the league with the smallest discrepancy, where players at the best paid team earn an average of 1.08 times as much as the players at the worst paid team in that league:
Does pay in these leagues affect results? Is one inherently fairer than the other? These are the kind of questions and debates that the report hopes to explore and foster.
The headline findings of the report, including the list of the best paid teams are freely available, here on this website, and at ESPN The Magazine. We will also carry more features and analysis arising from findings in the report on this site in the near future.
For those who want the full report, you can find details of its full contents, and how to order, here.
.


