By Brian Sears and
Nick Harris SJA Internet Sports Writer of the Year
1 January 2012
On the first day of 2012, we draw a line under 2011 by publishing below a variety of league tables from the last calendar year in English football.
This first table is a composite top 10 of any club who played in the Premier League and / or Football League for at least part of 2011, regardless of division.
Clubs played different numbers of games, so the rankings (for all tables below) are based on points per game.
On that basis, Crawley Town, the former non-league moneybags who made their Football League debut in August, are No1, having amassed 114 points from 50 games at a rate of 2.28 points per game.
Manchester United are second, with 2.23 points per game from 39 Premier League games, just ahead of rivals Manchester City, with 2.17 points per game from 36 games. Of course if City had played three more games and won them all, the Manchester sides would be level, or rather separated only by goal difference.
Southampton are fourth, having won promotion from League One then made a storming start in the Championship, and Huddersfield, who set a record Football League unbeaten run in 2011 (since broken), are fifth.
Liverpool fans can perhaps be buoyed by seeing their team at No10, which makes then No5 in the Premier League.
In calendar year 2010 – see the Premier League table for 2010 here – Liverpool were only No8 in the Prem. They’re on the up.
.
.
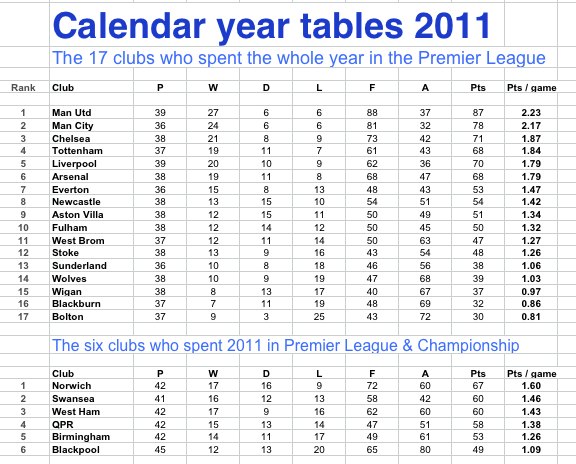
Looking at the clubs who spent the whole year in the Premier League next, United and City were of course No1 and No2.
It’s interesting to note (especially when wrapped up warm in your new Christmas anorak) that in calendar year 2010, United amassed 2.22 points per game. So they were better in 2011 by 0.01 point per game.
City were 0.38 points per game better in 2011 than 2010. This made them the most improved team in the Premier League, followed by Liverpool (0.35 points per game better off in 2011 than 2010) and Fulham (0.32 better).
Tottenham also improved in 2011, to 1.84 points per game from 1.78 in 2010.
Chelsea (declining by 0.16 points per game, year on year) and Arsenal (-0.05) have both got worse. Blackburn suffered the biggest drop in performance in the Premier League, from 1.42 points per game in 2010 to 0.86 points per game in 2011, a huge fall of 0.56 points per game.
Those 2010 numbers are linked here, and here’s 2011:
.
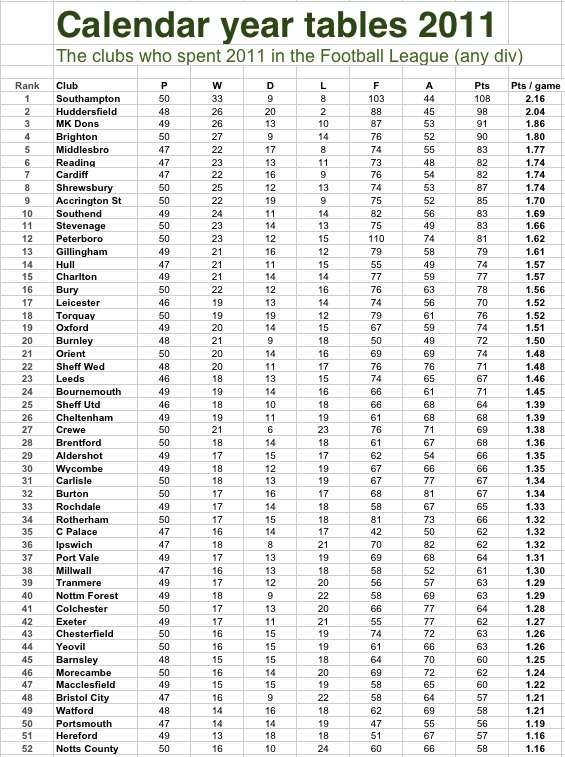
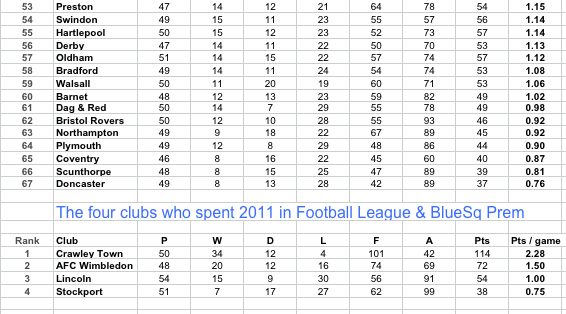
Which just leaves us with the Football League, which is self-explanatory.
Southampton and Huddersfield are No1 and No2, and the only teams in this group averaging more than two points per game in 2011.
At the other end, the woes of Plymouth, Coventry, Scunthorpe and Doncaster are obvious.
.
.
More on Man Utd / Man City /Arsenal / Liverpool / Chelsea (or search for anything else in box at top right)


