By Nick Harris
SJA Internet Sports Writer of the Year
13 August 2012
The past few days we’ve heard that Great Britain has enjoyed its best Olympic medal haul since 1908 but in relative terms London 2012 was much better for the hosts.
In 1908, there were only 2,008 competitors from 22 nations competing, and Britain provided a third of those by herself.
So one might reasonably have expected Britain to win a lot of the 110 gold medals on offer, on home turf and in home water, in events as varied as tug of war and motorboat racing.
Britain did indeed win lots of golds, 56 of them, or just more than half on offer. So that’s 51 per cent of golds with 34 per cent of the athletes, so Britain did 151 per cent as well as she should have done.
Here’s another way of thinking about it. If the 110 medals had been split fairly between all the 2,008 competitors, then each nation should have won 5.48 golds for each 100 athletes. Which means Britain, with 676 athletes, should have won 37 gold medals. Instead GB won 51 medals – again, that’s 151 per cent of what would be expected.
At London 2012, when the size of the competition is factored in, Great Britain thrashed that performance by doing 192 per cent as well as should be expected.
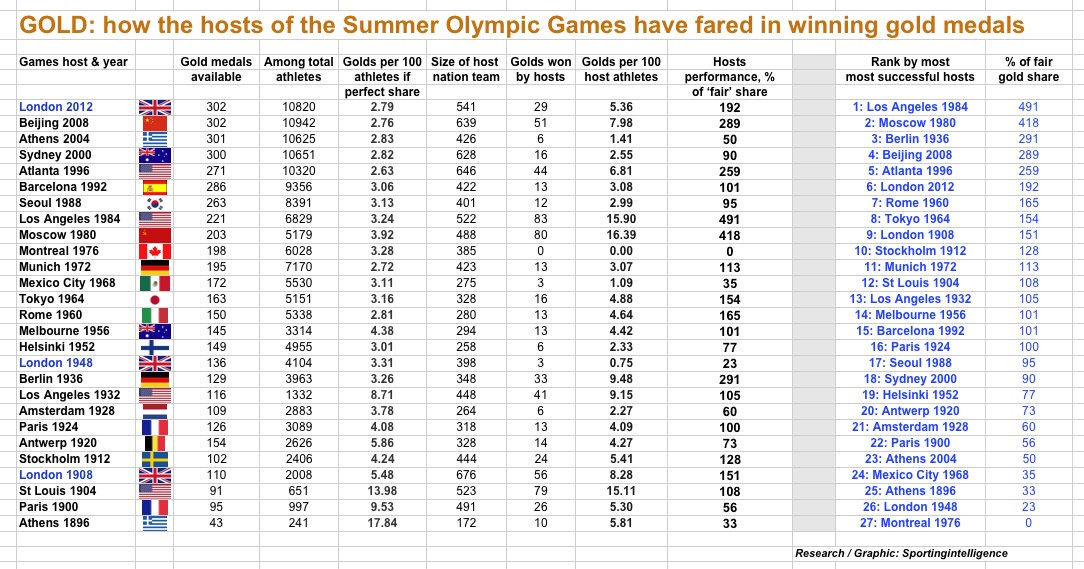
Sportingintelligence has analysed the host nations’ performances at all 27 Summer Games to date.
We consider:
1: the number of golds on offer.
2: the amount of athletes at the Games from all nations.
3: how many golds each nation should have won per 100 athletes if divided equally. Golds available per athlete have got harder and harder to win. There were 18 golds per 100 people in Athens in 1896 and now that figure is fewer than three golds per 100 competitiors.
4: how many competitors the host nation had, and how many golds they won.
5: the percentage performance rating.
The graphic below – click to enlarge – includes every host at every Games since the first modern Olympic in Greece in 1896 and allows us to see at a glance how times have changed.
The key columns are the amount of golds the host should expect (given the size of their teams) against the amount they got, and the ratio.
(Article continues below)
.
Great Britain’s performance at London 2012 rates as the sixth best host nation performance at any Summer Games by these measures (see blue column on the right-hand side above for rankings 1-27 of the 27 Games).
The five better performers were the USA (1984), Soviet Union (1980), Germany (1936), China (2008) and the USA (1996) and the first four of those can arguably be seen as political and / or propaganda Games, where huge tallies for the host were influenced by one or more of boycotts, state backing for political reasons or other interference.
At the other end of the scale, Canada in 1976 remain the only hosts never to win a gold medal at their own Games, while London in 1948 saw Britain perform 23 per cent as well as she should have done if the medals had been dished out fairly.
There is a twist in this tale of Britain at the Games, however.
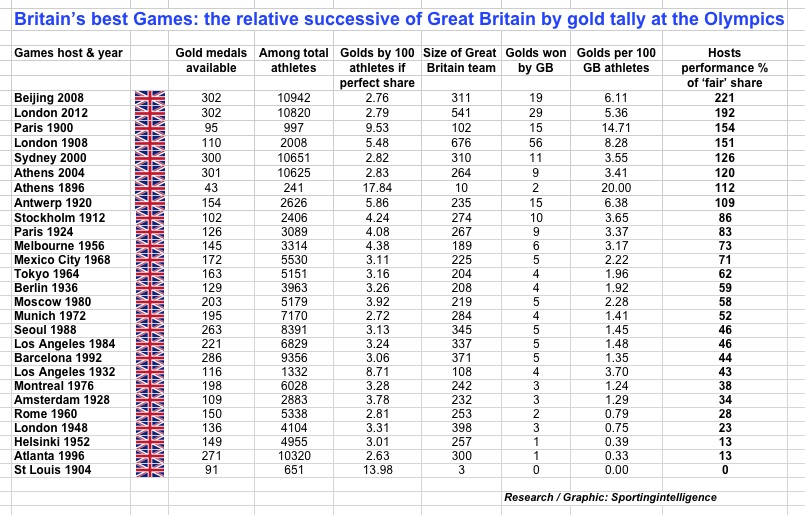
London 2012 was much better than the first-glance glory of 1908 but has not been Britain’s most successful Games to date, relatively. That was in 2008, when GB performed 221 per cent as well as expected.
This was because Team GB had ‘only’ 311 competitors in Beijing, against the army of 541 in London, an increase of 230 in four years.
The graphic below shows how Britain has performed in the 27 Games to date, ranking those performances.
Only eight times has Britain done as well as should be expected, and 19 times has failed to hit 100 per cent of a ‘fair share’ gold.
It is no accident that the last four Games, since Sydney in 2000, all fall within Britain’s six best Games by relative performance.
Money talks, and Lottery cash investment in British sport came on line ahead of Sydney 2000.
Home advantage – a well documented effect of hosting a Games – also helped to boost Britain this past fortnight.
.
. .
More stories on the Olympics on this site


