By Brian Sears
31 December 2014
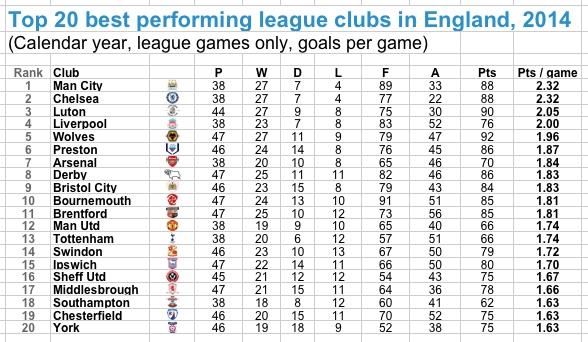
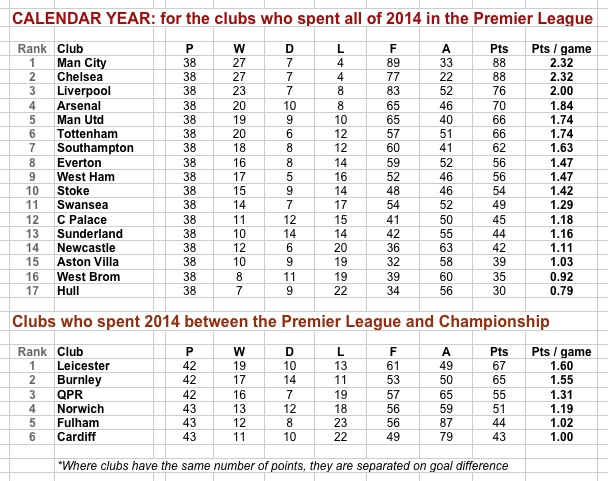
Of all the teams playing in the four main divisions of English football in 2014, Manchester City and Chelsea were the standout performers in the calendar year in terms of points per game. Both amassed 88 points from 38 league games in 2014 for 2.32 points per game on average, with City just pipping Chelsea on goal difference (+56 vs +55) for the year.
Each of those clubs have won 27 games in 2014, drawn seven and lost four and it is appropriate they head the calendar year table for England as they start 2015 as the two prime contenders to be champions of England this season.
Calendar year: bah humbug! That is a familiar refrain in some quarters when annual rather than season figures are produced but they serve a purpose beyond wrapping up a year and being a half-way marker in a season. When you look at the worst performing teams in particular, the calendar year data tends to highlight long-term problems that are not always immediate when looking at seasonal data. Certainly long-term issues are thrown into starker contrast.
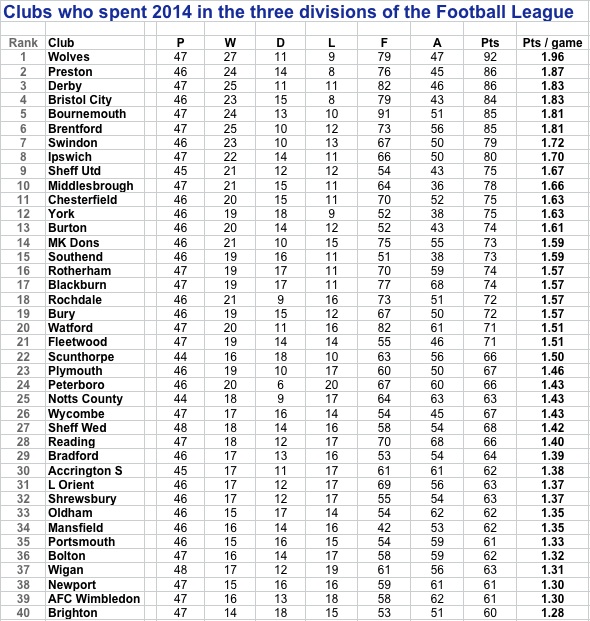
In all, 94 different teams spent all or part of 2014 in those the four divisions. Of those 94 clubs, only four – City, Chelsea, Luton and Liverpool – averaged two or more points per game. Again, this reminds us what a magnificent first half of 2014 Liverpool had, and what a relative flop they have been in the post-Suarez period.
The star performers outside that trio include resurgent Wolves and Preston, with Arsenal not doing so badly in seventh ahead of Derby, Bristol City and then a pair of Premier League aspirants, Bournemouth and Brentford, both just ahead of Manchester United.
Article continues below (NB: this graphic was updated on 5.1.15 to correct an error over games played by Luton)
.
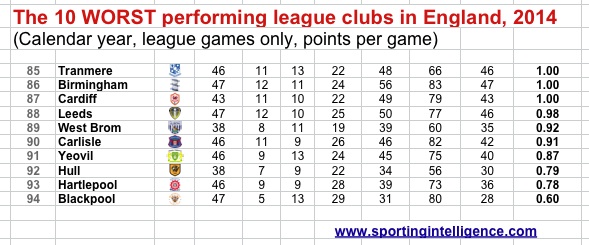
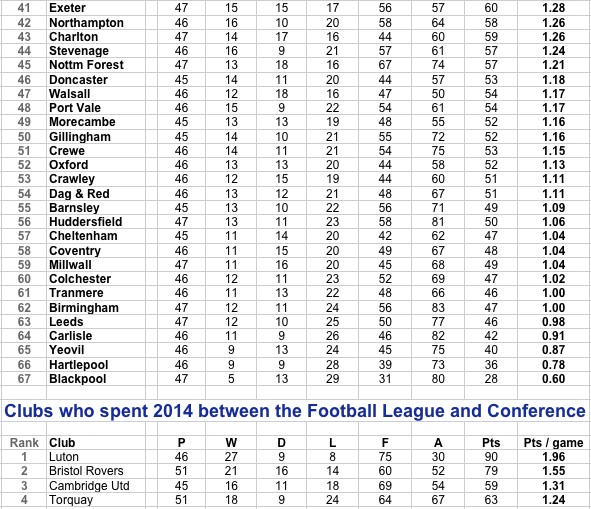
Next: the worst 10 performing clubs of 2014. Confirmation that Blackpool fans have good reason to be miserable. Thanks Oyston clan!
Also note that West Brom and Hull are the only Premier League clubs with less than a point per game. Their woes are long-term now. And Leeds fans see no signs of their struggles abating just yet.
Article continues below
.
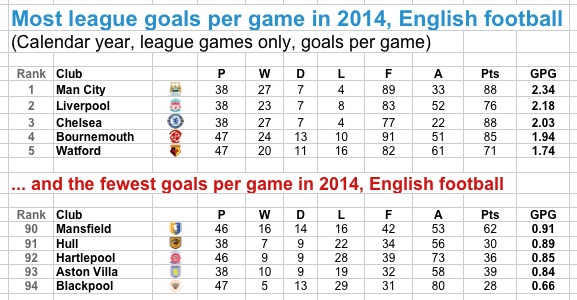
Before we move on to the divisional tables, here are some of the ‘most and least’ highlights among the 94 clubs in 2014:
Most wins: Man City, Chelsea, Luton, Wolves – all 27.
Fewest wins: Blackpool 5, Hull 7.
Most defeats: Blackpool 29, Hartlepool 28.
Most goals scored: Bournemouth 91, Man City 89.
Fewest goals scored: Blackpool 31, Aston Villa 32.
Most average team in England: The average points per game of all clubs is 1.38, so Accrington Stanley are closest.
.
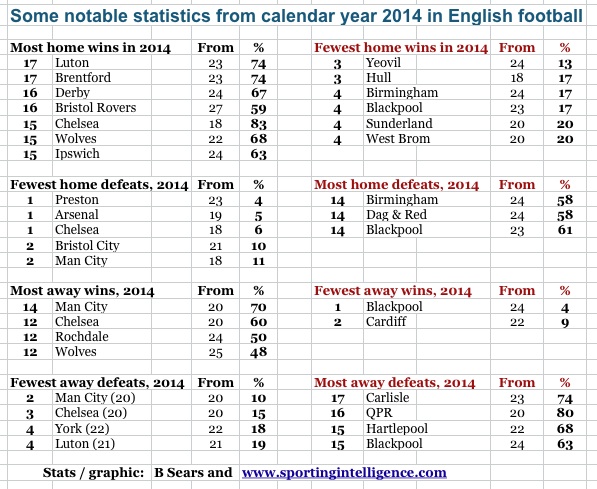
And while we’re on the subject of random stats:
Article continues below
.
And here are the tables by division: PREMIER LEAGUE
And here are the tables by division: FOOTBALL LEAGUE
(NB – Luton played 44 games, not 46, as per top graphic, so had 2.05 pts per game)
.
More on Man Utd / Arsenal (or search for anything else in box at top right)


