By Brian Sears
15 May 2015
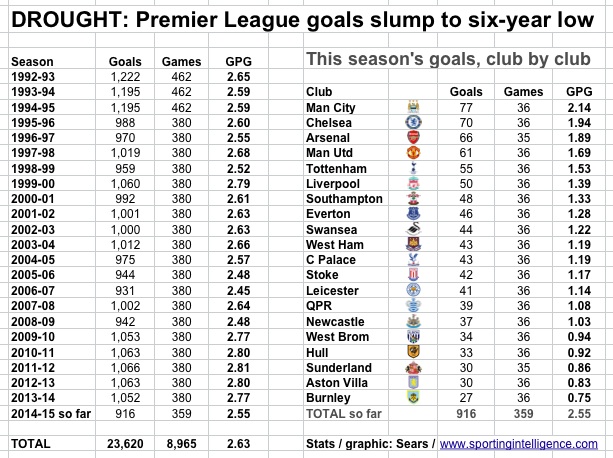
As the graphic above attests, Premier League goal scoring has slumped to a six-year low, and barring a deluge in the final week of the season, we will finish with the lowest rates since 2008-09.
Tthe 20 teams have scored 916 goals combined this season so far at a rate of 2.55 per game on average. That has only been lower in 1998-99 (2.52 goals per game), 2005-06, 2006-07 (Premier League low of 2.45) and 2008-09.
The goals scored by the individual clubs this season, listed above, show Manchester City on top with 77 goals and Liverpool in sixth with 50 goals. Last season that pair scored 102 goals and 101 league goals respectively. Yes, there are two games left to play but City have been firing at only about 80 per cent of last season’s rate and Liverpool at half the rate.
The lowest-scoring teams this season have also been scoring fewer goals as a group than the goal-shy sides of last year.
At this stage of the past five seasons, football statisticians have been sitting on the edge of their seats and still hoping for record levels of goals. It was three seasons ago that the current seasonal record of 1,066 PL goals was set, eclipsing the previous mark, from the season, by three. The past two seasons have come close to beating 1,066.
The current tally is 150 goals short of the record, and if the final games this week and next don’t provide more than 2.55 goals per game, the seasonal total will be below 1,000, let alone close to 1,066, and all that.
YOUNG JOURNALISTS — Apply for project funding HERE
One quirky statistic that jumps out of the goal stats this week in particular – 20 years to the week since Blackburn lifted the title – is that the total number of goals so far in the revamped top division has been 23,620. And one man, Alan Shearer, who was so prolific for so long, and scored the goals that helped Rovers to that title, scored 260 of them by himself. That’s 1.1 per cent of all Premier League goals.
..
And another thing …
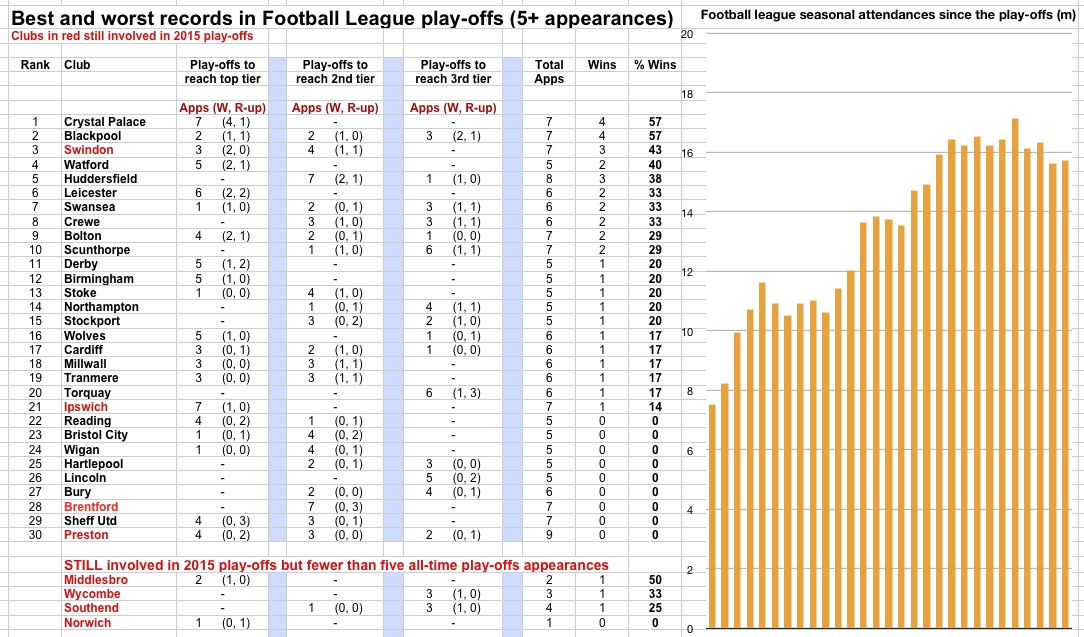
The play-offs in the Football League are heading towards their dramatic finales, and in the graphic below (click to enlarge) we look at the clubs with the best and worst records who have played in five or more play-offs since they were introduced in 1987.
Note how the Football League crowds have grown since then; certainly the drama of the play-offs has added to the allure of the divisions below the peak of the English game.
 Altogether 95 different clubs have been involved in the play-offs, including Chelsea and Manchester City. City are one of five clubs not in our graphic with a 100 per cent success rate in the play-offs, the others being Dagenham, Doncaster, Fleetwood and Sheffield Wednesday. Peterborough have a 75 per cent success rate, and West Ham, Burnley, Bradford and Walsall have all got a 67 per cent success rate.
But back to this season, where Middlesbrough and Brentford are vying for one slot in the Championship play-off final and Norwich and Ipswich are contesting the latest Old Farm derby for the other. Ipswich have one win in seven attempts and Norwich have zero from one. One that basis, Ipswich are best but have faltered often. Middlesbrough’s record is better than Brentford’s … and Ipswich’s.
The League One play-off final features the very poorest play-off club of all time (Preston, with zero wins from nine) against one of the most successful play-off teams, Swindon. And in League Two, Wycombe’s play-off record in percentage success terms just pips Southend’s.
.
…. And finally
The statistics in these pages will often be in relation to the Premier League era when they deal with English football. We know the game is a bit older than that. We know Preston won as Invincibles in the league’s first season in 1888-89. But the Premier League is a distinct era if only because of the money that has transformed the picture. This is the ‘monied era’.
To get some idea of how the financial situations of these clubs have changed over time – and finance is a big influence in success in football – further reading and related articles spring from Sportingintelligence’s annual global sports salaries reports, are linked here. The 2015 edition of the report will be published next week.
2014 Report 2013 Report 2012 Report 2011 Report 2010 Report
.
More on Liverpool / Man Utd / Arsenal (or search for anything else in box at top right)


