By Brian Sears
18 March 2016
St James’ Park hosts a north-east derby of particular significance this weekend as the outcome will swing the relegation scrap. Newcastle and Sunderland are both in the bottom four, respectively nine and eight points adrift of Swansea heading into the weekend.
If Rafa Benitez can guide his charges to victory then they and not Sunderland will start next week clear of the drop zone and be stronger favourites of the pair to retain their top-flight status.
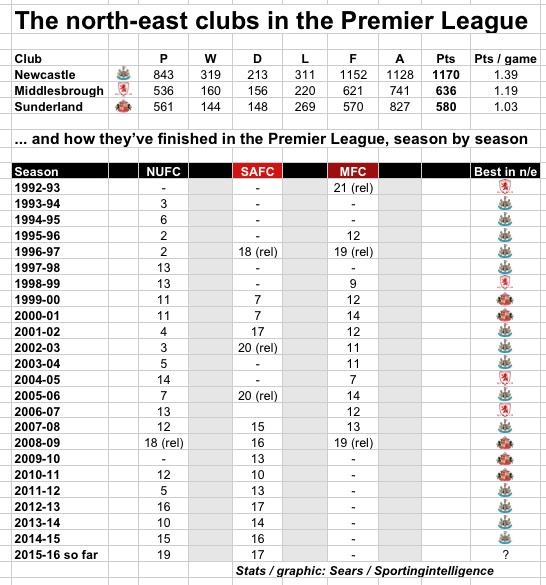
As the graphic below shows, Newcastle have by far the best record in the Premier League era of the three big north-east clubs. They’ve spent more years in the revamped division, won more points, gain higher finishes.
For the early part of their PL rivalry with Sunderland they also had the upper hand in head-to-head games, by a margin. They have played each other 27 times in Premier League games. In the first 19, Newcastle won nine to Sunderland’s three with seven games drawn.
But in the last eight clashes, they are without a win and are currently on a run of six straight defeats:
Newcastle’s six straight PL losses to Sunderland
14 Apr 2013 Newcastle 0 Sunderland 3 (Sessegnon, Johnson, Vaughan)
27 Oct 2013 Sunderland 2 (Fletcher, Borini) Newcastle 1 (Debuchy)
1 Feb 2014 Newcastle 0 Sunderland 3 (Borini pen, Johnson, Colback)
21 Dec 2014 Newcastle 0 Sunderland 1 (Johnson)
5 Apr 2015 Sunderland 1 (Defoe) Newcastle 0
25 Oct 2015 Sunderland 3 (Johnson pen, Jones, Fletcher) Newcastle 0
.
.
And another thing … high stakes in Manchester
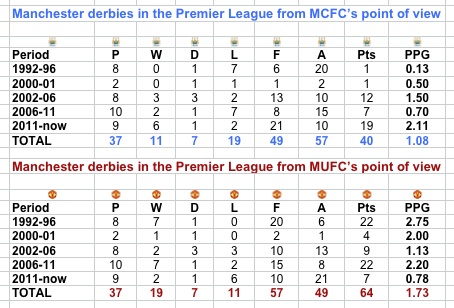
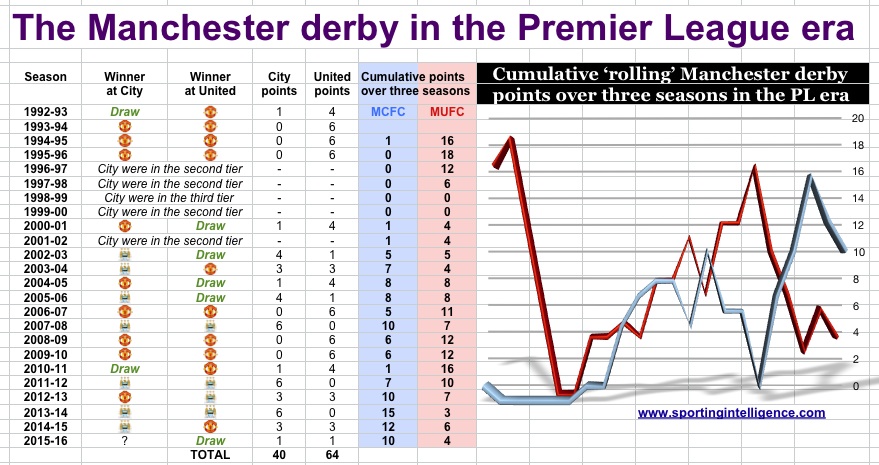
The Etihad Stadium will also be hosting a derby this weekend with huge importance at the other end of the table. Again the Premier League era has seen a turning of the tide in the results of the fixture between Manchester City and Manchester United.
From the 37 PL fixtures to date, United have 19 wins to City’s 11 wins, with seven draws, but six of those City wins have come in the last nine meetings.
.
United still have the better overall record of 64 points to 40 in the Premier League era, at an average of 1.73 points per game to City’s 1.08 points per game. But whereas it was United who routinely took something like two points per game (or a win and a draw each season), it’s City who have been achieving that in recent times.
The graphic below depicts the roller coaster relationship and how it swung City’s way.
.
.
…. And finally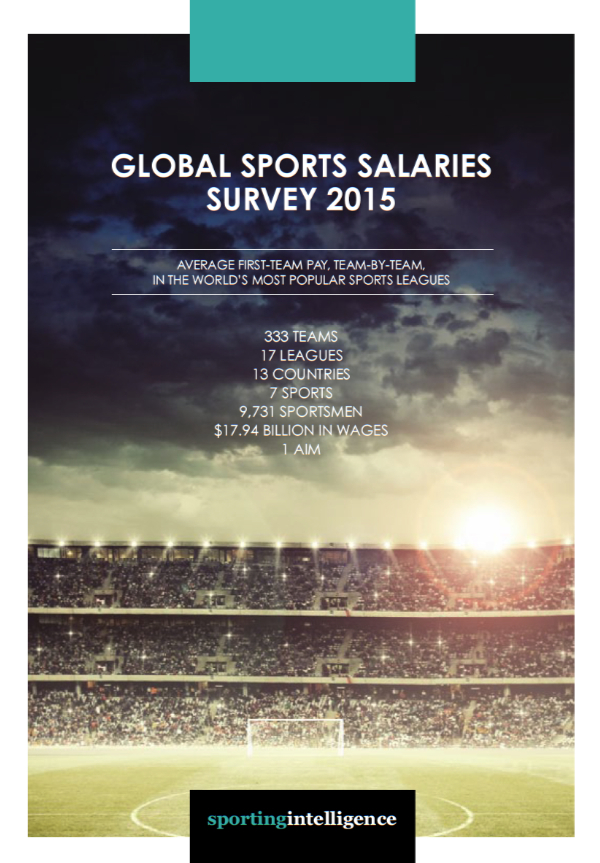
The statistics in these pages will often be in relation to the Premier League era when they deal with English football. We know the game is a bit older than that. We know Preston won as Invincibles in the league’s first season in 1888-89. But the Premier League is a distinct era if only because of the money that has transformed the picture. This is the ‘monied era’.
To get some idea of how the financial situations of these clubs have changed over time – and finance is a big influence in success in football – further reading and related articles spring from Sportingintelligence’s annual global sports salaries reports, are linked here. The 2015 edition of the report (right) was published in May.
You can download a free 120-page PDF here.
2014 Report 2013 Report 2012 Report 2011 Report 2010 Report
.
More on Arsenal / Liverpool / Man Utd (or search for anything else in box at top right)


